This is a good question…a question which lacks a simple answer without quite a bit of analysis.
We audit out-licensing processes, and there are times when the answer is an outright “No.”
But sometimes, the answer is “Maybe,” provided some changes are made to the process, or provided additional data and details are added to the overall story.
In some cases, it’s not the asset nor the story, but the person(s) executing the out-licensing process.
Now that can be an uncomfortable conversation…
Differences Across Therapeutic Area
One aspect of out-licensing which everybody understand, but yet is rarely talked about. That is, the intersection between Stage of Development and Therapeutic Area…by Company.
This simply means that prospective licensees have different preferences about which therapeutic areas are of interest for in licensing.
In addition, within a specific therapeutic area, companies will have differences with respect to the stage of development (and, hence, the risk they are willing to accept).
Thus, an important part of our audits and our out-licensing processes on behalf of clients is to understand the answers to two rather fundamental questions:
- Which companies may be interested in my asset due to their stated (or unstated) interest (and not necessarily presence) in my therapeutic area or indication?
- Of those companies identified, which ones are potentially interested in assets at the same stage of development / ROI as my asset?
Giniatullina, et al. are one of the few groups to try to answer the first question.
In their analysis, the authors quantified the therapeutic interests of multinational companies between 2005 and 2012.
What we find interesting is their Table 1, which maps Big Pharma partnering interest by therapeutic area. A larger table is available as a Supplement to the original paper.
Now the data behind this Table were gathered in 2012.
So basing an out-licensing process on this table could lead to wasted effort (not to mention that some of the companies in the table no longer exist).
Regardless, the point here is very clear…different companies have different biases and desires when it comes to the in-licensing of assets.
Thus, a rifle shot approach, targeting specific companies with specific, tailored messages will be more fruitful, as opposed to trying to convince companies that the opportunity is large, cheap, and worth the effort of changing an established in-licensing strategy.
Stage of Development
Company web sites tend to be somewhat vague about their preferences for in-licensing stage of development. This makes sense in that they do not want to close the door on a potentially good opportunity.
Plus the process can also offer a channel of competitive intelligence for their internal programs.
In order to understand how transactions differ by stage of development and by therapeutic area, we pulled data from MedTrack. They define “Partnerships” to mean Product Acquisitions, JV, Licenses, R&D Agreements, and the like.
Venture Financings are not included in Partnerships. But future analyses will look to see if the venture community follows the licensing community (we suspect it does).
Let’s first look at Cardiovascular Partnerships:
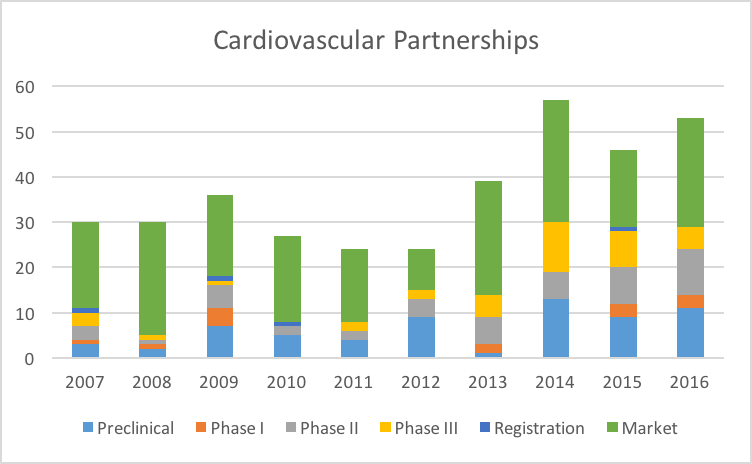
Partnerships in the Cardiovascular space have ben steadily growing since 2007. We will discuss the growth rate issue in a moment. But even more interesting is looking at the Partnerships by Stage of Development:

What we see is a strong preference for Cardiovascular assets which are already on the Market. Assets which are in Phase III or even undergoing Regulatory review are not as interesting compared to On Market assets.
Let’s compare these patterns to Oncology:
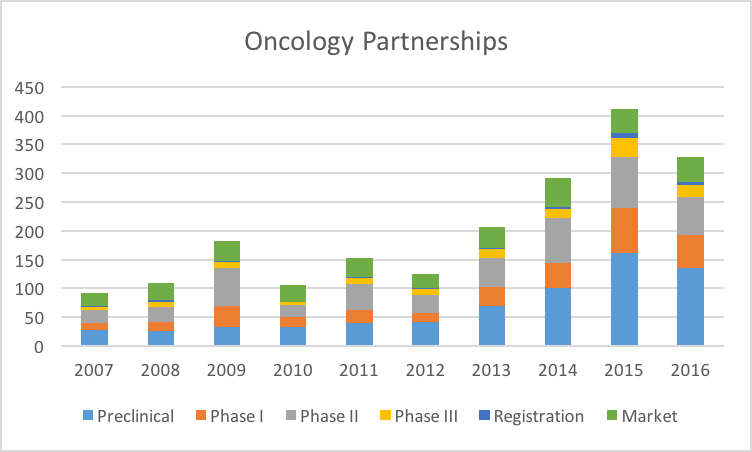
It is clear from this and other data that the Industry is extremely interested in Oncology assets, for a variety of reasons (favorable pricing and reimbursement, high unmet medical need, etc.). So the scale of Oncology partnerships dwarfs that of Cardiovascular and other therapeutic areas.
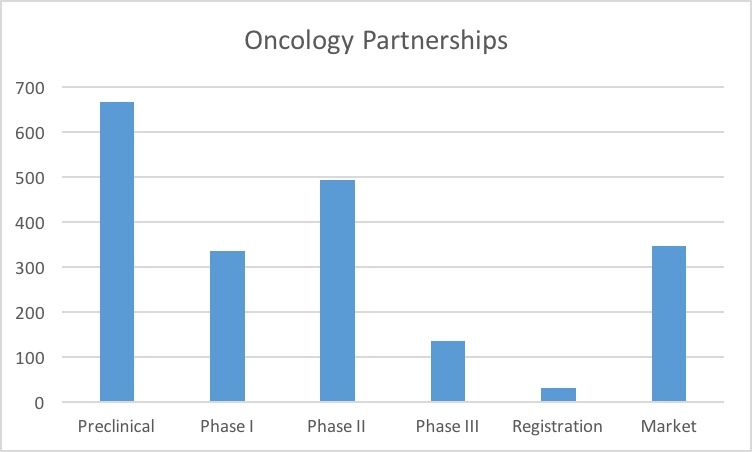
Unlike the Cardiovascular market, our industry has a strong preference towards Preclinical Oncology assets. This makes sense when one also factors in the clinical development investment required for oncology versus cardiovascular.
We were slightly surprised by the drop off in Phase III versus Phase II. It is possible that the best clinical stage assets are picked off after Phase II, leaving a paucity of opportunities for licensing in Phase III.
Ophthalmology is an interesting area. There are clearly fewer transactions over the time period studies (207 versus 366 for cardiovascular and 2,006 for oncology).

More interesting is the pattern by stage:

Ophthalmology has a reputation which suggests that companies are not interested in Preclinical assets and transactions. Yet these data demonstrate otherwise.
What is clear is that an unlicensed Preclinical Ophthalmology asset may require an effort to raise enough capital to take it through a Phase II trial before the licensing “window” reopens for that asset.
Lastly, we look at Neurology Partnerships:

We were surprised by the sheer number of Partnerships in Neurology (883) compared to Cardiovascular (366). Future posts will delve into this in more detail.

As with Cardiovascular Partnerships, the market prefers Neurology assets on Market. But there is a definite appetite for Preclinical assets.
* ~ * ~ * ~ *
Is It Licensable?
Stepping back, we admit that these data are sweeping generalizations. Each asset and situation is different. But what it does suggest is that different assets in different indications may require different approaches to achieve monetization.
Every situation is obviously different. So we would not recommend reading too much into these data. Indeed, one factor which is not taken into account is the actual number of assets available.
It is likely that there are simply more Preclinical Oncology assets available than Preclinical Ophthalmology assets, i.e., due to more academic research in cancer versus ophthalmology.
Regardless, what we can say is that it pays to do your homework while developing an out-licensing plan.
For example, for an Ophthalmology asset, a simplistic approach may be:
- Pursue a license at Preclinical
- If unsuccessful, raise enough capital for all work through a Phase IIa, then re-pursue a license
Now this assumes that the asset has merit, and matches the areas and indications of interest to the few companies who are the potential licensing partners, of which there may be very few.
Thus, the development of an asset monetization strategy entails:
- Understanding which companies are in your specific therapeutic areas.
- Understand their licensing and portfolio history.
- Ranking (and perhaps rethinking) what you think your lead asset is relative to others in your portfolio. Is our more advanced asset the most attractive asset from a licensing perspective?
The Good News
These data potentially show the increased interest and willingness of our industry to engage in partnerships. Each of the four therapeutic areas selected demonstrated a 7%-15% annual growth rate in partnerships per year, which is great news for academia and venture-backed companies.
However, it is also clear that an attempt to monetize an asset by talking to anyone who will listen will be met with a lot of resistance. Understanding which companies (or investors) are interested in specific therapeutic areas and specific stages of development is critical for an efficient, reality-based approach to out-licensing.