
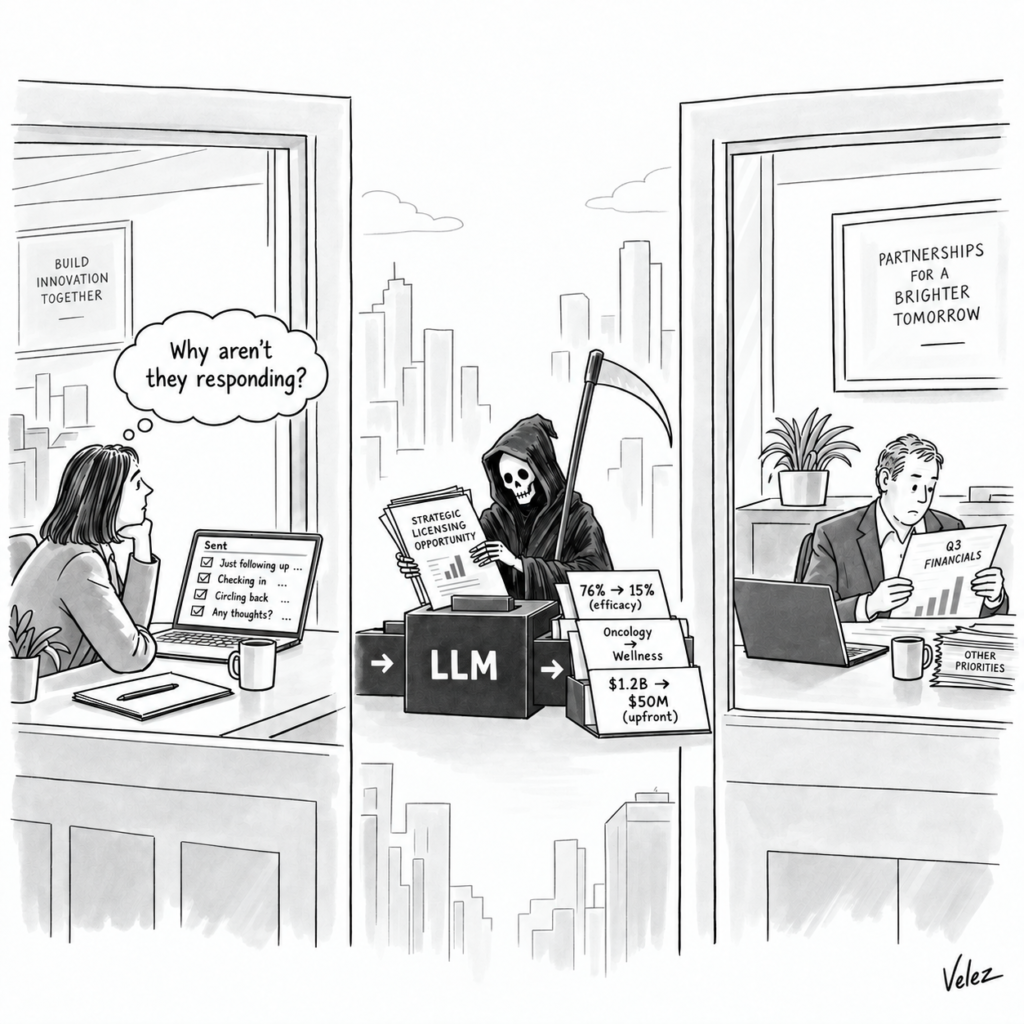
We all know what “Death by PowerPoint” means.
It’s that fifty-slide odyssey where, somewhere around slide 34, the email simply must be checked, the LinkedIn app buzzed (Did it really?), and even the person who built the deck starts wondering why there are three separate slides on manufacturing scale-up.
We’ve all sat through it. Many of us have inflicted it upon each other. Thanks, pal.
But here’s the 2026 edition!
Your audience just changed, and it doesn’t get bored. But it can get it wrong.
Increasingly, the first “reader” of your out-licensing deck isn’t the VP of BD at the licensee. It’s an LLM, quietly summarizing your monstrous deck before anyone with a pulse opens the PDF.
Unlike a bored human, the machine doesn’t yawn, check Instagram, or ask you to skip ahead to the data.
It reads confidently, draws a conclusion, and moves on…sometimes making mistakes or inventing facts along the way, while never mentioning them to anyone.
Same funeral. New Grim Reaper.
Except this one sits on a server in the middle of a data center nobody wants to live near.
The rule I teach
In my BD&L courses I teach a simple design rule: no more than two graphs per slide, and nothing in a font size that requires the reader to have recently seen an optometrist.
For years I sold this as basic mercy, sparing a tired evaluator reading your deck at 7 pm on the train home before a group meeting the following morning.
As it turns out I was underselling it. It’s closer to risk management now because the reader who matters most might not be human.
But is this really an issue?
An Experiment
Can LLMs reliably read PDFs containing densely populated slides with a lot of text and graphs?
Let’s see.
Let’s look at Deutsche Bank’s Q2 2026 BioPharma Equity Capital Markets Review (ask your DB representative for a copy).
The deck is, by ordinary standards, not terrible.
It is seven slides in total, of which 4 are densely packed with various charts and graphs. In keeping with the company’s color scheme, the bar charts are various shades of blue.
Very pretty.
But the text is small. Eyeballing it, it’s around Font 10 or less.
I uploaded it to ChatGPT, and I asked a rather obvious question:
Can you read all of the numbers and details? Are there areas of these slides or graphs which are unclear? Would converting this PDF to a Markdown file help?
The answer was quite interesting:
“I can read the main story, most slide titles, bullets, legends, and many labeled numbers, but I cannot reliably read all of the chart-level details from the slides as rendered.”
It got the vibe, as the young people would say. But it did not get the numbers.
It continued:
“For a human viewer, the deck is usable. For machine reading, it is risky.”
“Some small labels, such as 2%, 4%, 6%, and 7%, are difficult to read and easy to misassign to the wrong category.”
Case in point, and this one’s not hypothetical: the very first chart in the deck stacks four YTD performance numbers within a few pixels of each other, distinguished only by which of four nearly identical shades of blue they’re printed in.
A human squints, traces the line back, and works it out. Annoying, but doable.
The model might just guess, and it isn’t obligated to tell you it guessed.
It also flagged the two pie charts, both requiring the reader to map colors back to a legend sitting several inches away:
“LLMs often struggle with this unless the chart is converted into a table.”
And then, on the tempting “just convert it to Markdown” fix:
“A Markdown version would help, but only if it is intentionally structured for LLM ingestion. A raw PDF-to-MD conversion is not enough.”
Read that last line again.
The model just told me, unprompted, that “converting your deck to a machine-friendly format” doesn’t actually make it machine-friendly unless someone does the re-structuring work first.
That’s the AI equivalent of your doctor telling you the home remedy isn’t working and, gently, that you should probably see an actual professional.
Suppose for a moment that those small numbers referred to your tox data, or your PK data, or even your efficacy data.
Your prospective Licensee’s LLM can’t read the data accurately, and proceeds to prepare their deck summary based on what it thinks it read, not what you actually put on the slide.
That’s a problem.
This isn’t new
Before anyone accuses me of discovering fire here, please recognize that this is not a new problem.
Back in early 2024, researchers ran GPT-4’s vision model through a standard visualization literacy test, the same one used to benchmark actual humans (Bendeck & Stasko, 2024).
It landed around the 16th percentile of human performance.
Sixteenth percentile.
The same study documented GPT-4 consistently misreading color legends on multi-color charts, the exact failure mode my Deutsche Bank pie charts triggered, two years later.
By the end of 2024, on a much harder chart-reasoning benchmark called CharXiv, the best model available at the time (Claude 3.5 Sonnet) had climbed to 60.2% accuracy on reasoning questions about real scientific charts (Wang et al., 2024).
That’s real progress.
By the way, humans, on the same test, scored 80.5%. So the gap closed, but it did not close all the way.
I don’t have a clean, independently verified number for exactly how good today’s models are on that same benchmark, and I won’t pretend I do.
Any number I quote here will probably look quaint within a year, which is sort of the whole point.
Models are getting better at this, and fast. But “better” and “safe to assume it read your deck correctly” are two different things, and out-licensing materials get sent to people, and their AI tools, that you neither control nor get to audit.
You cannot know, the moment you hit send, which model, which wrapper, or which mood your recipient’s AI woke up in.
That uncertainty is the risk, and not a specific accuracy percentage you can footnote and move on from.
Does this mean shorter decks?
If the recipient’s AI is doing the reading, do we all need to cap our decks at 30 slides out of mercy for the machine?
Can we send a 100-page supplemental deck behind a tight 25-slide core?
Or a 100-page Markdown brief?
A link to a cache of non-confidential patents and papers?
What do we do?
The traditional advice is to “keep it short.”
The advice is now potentially wrong when sharing digital information.
This is the part I found useful to think through, because it inverts most of what we’ve all been taught about decks.
An LLM’s context window can swallow and digest a hundred-plus pages of text without complaint.
Volume was never really the problem. Charts were the problem.
A twenty-five-slide deck with slides that have overlapping pie charts and 6-point font is more dangerous to a machine reader than a hundred-page, text-dense scientific brief, because the brief has nothing to visually misread.
No legend to get backwards.
No shade of blue to confuse with its neighbor.
Just words, and words are the one format every LLM on the planet is genuinely good at.
So here’s the tiered approach I recommend, and the one I’m building into my own materials:
A short, clean core deck. Keep it lean for the humans in the room, because nobody, carbon-based or silicon-based, benefits from sitting through fifty slides. This is a meeting-length constraint, not a machine one. Have 20 minutes at a partnering event? Ten slides. Tops. Have an hour on Zoom? Maybe 25 slides. Maybe.
A longer, text-native supplemental brief. This is the scientific and clinical detail, written out in full sentences, not just plotted. This can run long. It should run long. Document length stopped being the enemy the moment your primary reader stopped getting tired around slide 34. Check with your audience / recipient in advance. They may still want to see pretty pictures on slides. Ok. But don’t forget the Deutsche Bank experiment. One or two graphs at most per slide, and a nice, large font.
And if you’re tempted to just link to a folder of non-confidential patents and papers instead of attaching them, don’t assume the AI goes and fetches them. Most corporate IT policies make it difficult for recipients to click on external links.
If it isn’t confidential, attach it. Don’t send the robot on a scavenger hunt it probably won’t finish.
A recent piece on PDF parsing for LLMs put the underlying issue bluntly: chart extraction remains “unsolved,” and “the good-looking failures are the dangerous ones” (Brosse, 2025).
That’s the whole ballgame, honestly.
A chart that looks perfectly transcribed and is subtly wrong is far more dangerous than one the model openly admits it struggled with.
At least ChatGPT had the decency to tell me. Will the Licensee’s LLM extend you the same courtesy.
I doubt it.
Where I’ve landed
Cap the charts per slide. My two-graph rule stands; perhaps more stubbornly than ever.
Write the takeaway of every chart in an actual sentence, near the chart. If a human doesn’t need to squint to get the point, neither does the machine.
Build the tiered set: lean deck for the meeting, dense brief for the AI (and for the human who actually wants the details), non-confidential supporting material attached rather than linked.
Don’t run your deck through a generic PDF-to-Markdown converter and call the problem solved. As the model itself pointed out, that step is both necessary and nowhere near sufficient.
Test your own materials before you send them. Upload the deck. Ask the most literal, boring question you can: can you read this? You may not love the answer. You’ll still like it more than finding out later that a licensee’s internal assessment quietly ran on the wrong percentage lifted off your slide 14.
“Death by PowerPoint” used to mean boring your audience into a stupor. Now it might mean quietly misleading an algorithm into a bad conclusion before a human ever gets the chance to be bored.
Either way, the deck dies. The only real question is whether it goes quietly, or takes your deal terms down with it.
I’d genuinely like to know. Has anyone else tried this on their own materials? What did your AI reader miss?
References
Bendeck, A., & Stasko, J. (2024). An empirical evaluation of the GPT-4 multimodal language model on visualization literacy tasks. IEEE Transactions on Visualization and Computer Graphics. https://doi.org/10.1109/TVCG.2024.3456155 (author copy: https://faculty.cc.gatech.edu/~john.stasko/papers/vis24-llm.pdf)
Brosse, N. (2025, February 18). PDF parsing for LLM input. Nicolas’ Notebook. https://nbrosse.github.io/posts/pdf-parsing/pdf-parsing.html
Deutsche Bank Investment Bank. (2026, July). BioPharma equity capital markets: 2026 Q2 review [Internal client presentation]. Not publicly available — request a copy from your Deutsche Bank ECM representative.
OpenAI. (2026). ChatGPT (September 2026 version) [Large language model]. https://chatgpt.com
Wang, Z., Xia, M., He, L., Chen, H., Liu, Y., Zhu, R., Liang, K., Wu, X., Liu, H., Malladi, S., Chevalier, A., Arora, S., & Chen, D. (2024). CharXiv: Charting gaps in realistic chart understanding in multimodal LLMs. arXiv:2406.18521. https://arxiv.org/abs/2406.18521 (leaderboard updates: https://github.com/princeton-nlp/CharXiv)