On October 13, Wharton Human-AI Research and GBK Collective released the fourth edition of their annual enterprise AI study, The Adaptive Advantage: Who’s Winning with AI and How (Wharton & GBK, 2026a). The summary is a bit dense because it is packed with data on slides with very tiny fonts, and it’s obviously not industry specific.
But it’s worth the careful slog as you think about AI deployment within and across various departments within biopharma.
Most of the headlines will be about adoption, and the numbers are interesting, considering how young AI actually is. Among managers and above, 91% now use AI more than weekly and 62% use it daily. But only 28% report strongly positive ROI, which is the subject of perhaps another post.
The finding I keep coming back to is a different one. It’s about how far an organization lets AI act, and it has a shape that should make every BD head perhaps a little uncomfortable.
What This Data Is (and Isn’t)
The survey ran from July 9 to July 29, 2026, and reached about 1,400 full-time employees at US companies with more than 1,000 employees and over $50 million in revenue. About 1,000 respondents were managers or above.
Respondents came from nine functions, including IT, Finance, Legal, HR, and Marketing/Sales. So none of this is BD-specific.
It’s an analogy, and the findings are self-reported and correlational. But when a survey sample this large keeps pointing in one direction, we should all pay attention.
The Ladder Has a Dip in It
The study asks departments how much freedom they give AI to act. Two-thirds (67%) say they use AI agents in some form, but only 17% let an agent finish a task without a person approving each step. That produces a four-step ladder, from least to most autonomy (x-axis, Figure 1):
- AI suggests or drafts, and a person makes every final call.
- AI does the work, and a person reviews and approves all of it.
- AI does the work, and a person checks only a sample afterward.
- AI acts on its own, under real-time monitoring and guardrails.
The study then asks how many departments at each step have achieved “workflow transformation”, where AI is fully embedded in core processes, agents are in use, and workflows have changed significantly. Figure 1 shows the result, with workflow transformation on the y-axis.
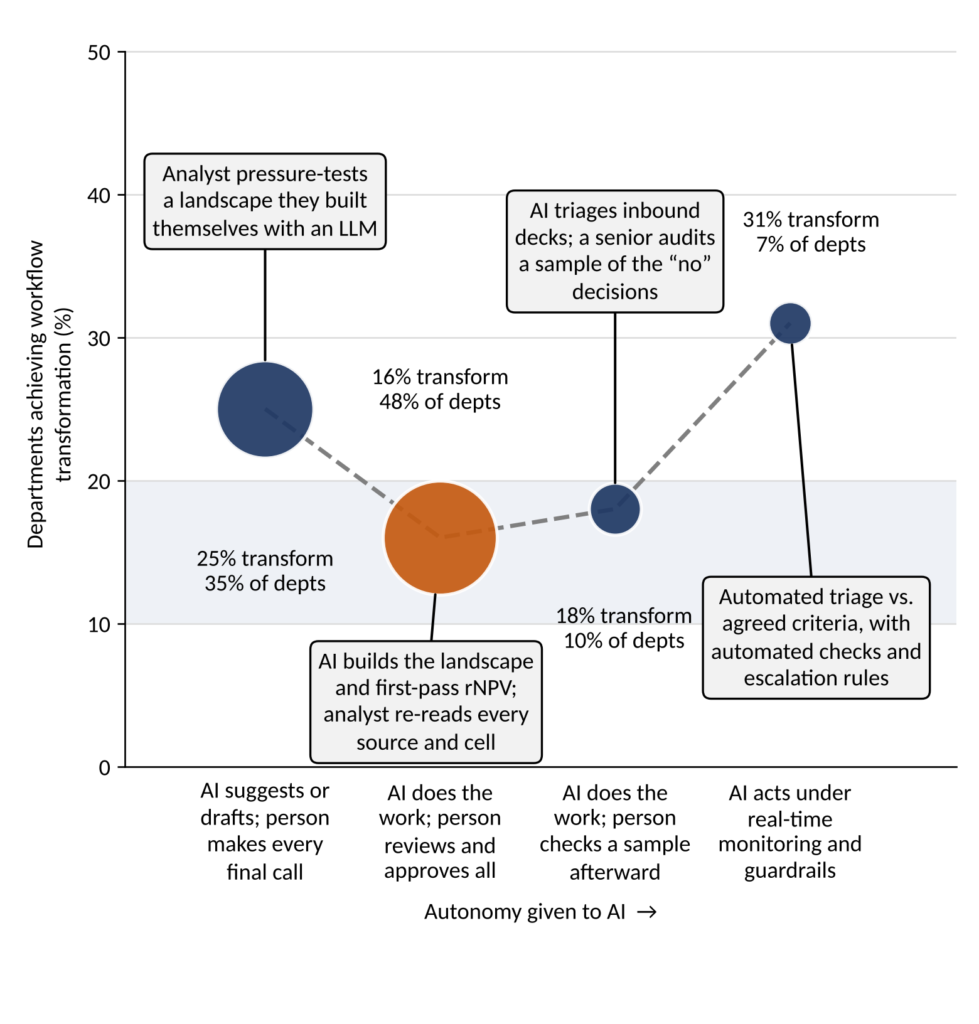
Figure 1: Workflow transformation as a function of AI autonomy. The bubble area is proportional to the share of departments at surveyed companies at each rung of the AI autonomy ladder. Callout boxes are hypothetical scenarios from the BD perspective. The shaded band marks the dip: the two middle rungs, where fewer than one in five departments achieve workflow transformation. Source: Lacerta Bio interpretation of data from Wharton & GBK (2026a).
ROI follows the same shape. According to the report, organizations are rewarded for reaching the far end of the roadmap and suffer while they are in the middle. GBK’s Brian Smith describes most companies as sitting in a “supervised middle,” paying for autonomy and then spending time reviewing every action (Knowledge at Wharton, 2026).
My view is that the middle is the most expensive place to be. You pay for the AI, and you still pay a human to redo the verification, so neither cost goes down. Nothing about the workflow changes either, which may be why the middle also scores poorly on transformation. If anything, it may become slower, as opposed to faster.
In BD terms, imagine for a moment the first-pass competitive landscape that an analyst must re-read source by source because nobody trusts the output, and the analyst does not want to develop a reputation for delivering slop.
That isn’t a workflow redesign.
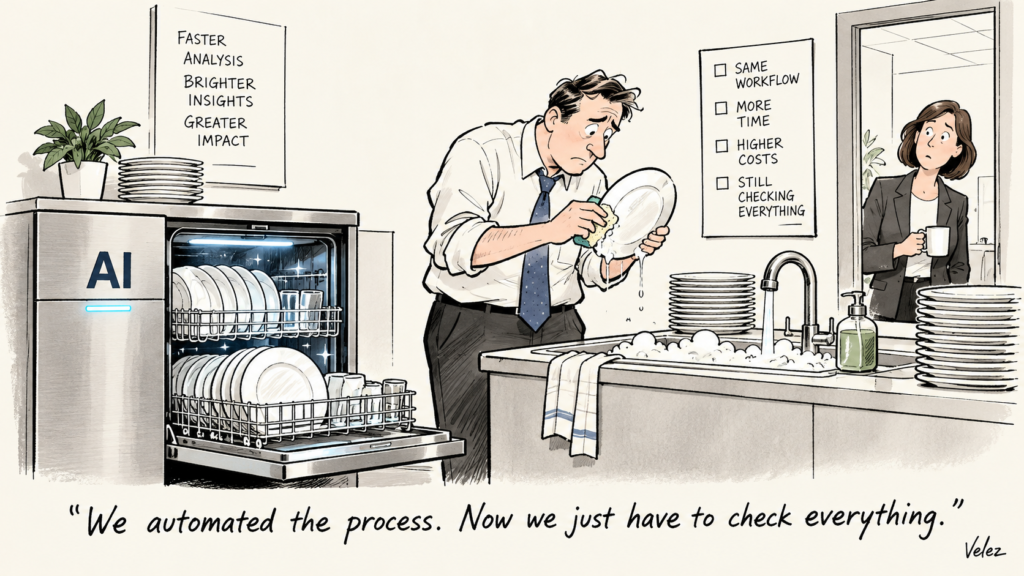
It’s buying a dishwasher and then hand-washing every plate afterward to be sure.
Same dishes, more time, and now there’s a $1,200 plate rack with Wi-Fi and its own app on the department’s spending plan.
Pick a Rung per Task, Then Commit
This is not an argument to automate everything. Indeed, in my own AI course, I try to make it clear that you don’t have to “AI everything.” The report is clear that autonomy depends more on risk than on capability.
Among departments that let AI act at least at the sign-off stage, 66% of managers and above say their department lets AI complete low-impact internal tasks, and 63% say it handles routine operations. Only 45% say it can take actions that affect customers or other outside parties, and 32% say it can take irreversible financial or legal actions. That last number is higher than I expected, especially next to the 17% of departments that let AI act without approval. The report doesn’t reconcile the two, but one clue is that the answer depends on who is asked: 42% of C-suite respondents say their department allows irreversible actions, compared with 24% of managers and directors. I’d read the 32% as what managers and above say their departments allow, not as a count of what agents actually do.
The barriers managers cite are trust and risk: data security (43%), regulation (24%), and distrust of the AI’s reasoning (23%).
Most interestingly, a shortage of skills ranks last, at 8%.
I think that instinct is right, and it matches the rule I give in my AI for BD&L course (Velez, 2026a), namely, that materiality should increase human involvement, not AI autonomy. The mistake is applying one posture to everything.
I think BD work has at least three tiers:
- Low materiality (High volume work with reversible decisions). Tasks such as inbound triage, first-pass landscapes, data room indexing. The grunt work, so to speak. For this kind of work, we should aim for the far end of the ladder via pre-agreed criteria, automated checks, escalation rules, and audits of the “no” decisions. Re-reading everything defeats the purpose.
- Medium materiality. Includes tasks such as rNPV first drafts, patent summaries, and competitor tables. Here a human review stays, but it should be targeted. Either AI advises and a person produces, or AI produces inside a workflow with source traceability and built-in checks, so the reviewer examines the assumptions and the flagged items rather than every cell. This matters most for the assumptions in a financial model, such as peak sales, probability of success, and discount rate.
- High materiality. The valuation sign-off, the recommendation to the committee, the negotiation, the term sheet. A person owns these, while AI advises.
Paradoxically, departments that let agents take irreversible financial or legal actions have transformed their workflows more often (29% compared with 13% of departments that limit agents to narrower tasks). The report’s explanation is that these departments have built AI into the core of how work gets done, not that they simply run more agents.
I wouldn’t read that as a mandate to let a model sign a term sheet. At some point, someone has to justify that action to a Board (or, worse, to a Judge).
Who Owns the Error?
Accountability is perhaps the least settled part of this entire picture.
Ask departments who is responsible when an AI agent gets something wrong, and there is no clear answer. The most common response, a governance or risk team, comes in at only 28%. The deploying employee’s manager and the employee themselves are close behind. Responsibility is spread across several people, and most departments haven’t decided which of them owns the outcome.
The uncertainty is greatest in the middle of the organization. One in five managers and directors say nobody is accountable, or that they can’t say, compared with only 3% of VPs and above. The people closest to the work are the least sure who answers for it.
Oversight isn’t the problem. Fewer than 1% of departments report no formal process for checking agent performance. The problem is ownership.
BD has an answer, and it’s the simplest rule I know: every AI workflow ends with a named decision owner, as I argued in Part 2 of the pyramid-to-T series.
That fits the “squeezed middle” I described in Part 3. If the managers and directors closest to the work can’t say who answers for an agent’s error, the workflow wasn’t designed.
It just happened.
Count What the Funnel Produces, Not What the Analyst Saves
The biggest gap in the report is between expectation and measurement. 83% of managers and above expect AI to fundamentally transform or majorly impact their industry within two to five years.
Yet “hours saved” is the most common way departments judge their AI investment (40%), and net-new revenue is the least used of the major measures (27%). Asked what AI’s primary job is over the next 12 to 24 months, 52% say improving productivity or cutting costs, while only 22% say growing the business.
Is that merely semantics? No. This matters. Departments that track at least one growth measure (like net-new revenue, sales conversion, output volume, or customer satisfaction) report strongly positive returns 35% of the time. For those tracking efficiency alone, it’s 13%.
BD is a cost center, as I argued in Part 1, so the temptation is to measure AI the way finance would, i.e., headcount avoided, hours saved, and so on. That’s the efficiency-only lens, the group with 13% strongly positive returns.
The BD equivalents of “output volume” and “conversion” may look more like this:
- Opportunities evaluated per individual on the BD team
- Time to a defensible “no” (and to a defensible “yes”)
- Share of candidates sourced proactively rather than inbound
- Share of evaluations that reach a term sheet
- Quality of the “no” decisions, i.e., how many were later regretted
That is the logic behind Widening the Funnel. If roughly 2,000 inbound opportunities become about 15 executed deals, as in the AbbVie numbers I used there, the prize for AI isn’t a cheaper analyst.
It’s a wider funnel at the same or better quality, with equal or greater diligence rigor and speed.
Interestingly, only 40% of managers and above are very confident their organization can track total AI spend once costs bundled into other software and cloud services are counted. And the cost of tools, compute, and licenses is already the most-cited barrier to stronger returns (34%, level with AI performance problems).
If you plan to prove ROI for your BD stem, set up the cost line before the benefit line.
A Settled Approach Beats a Perfect One
Among organizations standardized on a single approved platform, 50% report strongly positive ROI. That falls to 30% where multiple approved tools run under a formal policy, and to 19% where a central hub or orchestration layer is used. Only 9% of organizations still experimenting without a defined approach report strongly positive ROI.
The report’s conclusion is that the main goal is any settled approach, not a specific one.
Ownership shows a similar pattern. Among managers and above, 58% report strongly positive ROI in organizations with a newly designated Chief AI Officer, compared with 24% where the responsibility was added to an existing executive and 8% where no such role exists and none is planned.
For a BD group, this is the “govern the stem” point from Part 2. You may not get to choose the company platform, but you can set your own rules for approved tools, what may leave the building under a CDA, and who decides.
Open-ended experimentation feels like freedom, but the data says it’s the 9%.
You don’t want to be part of the 9%.
Where the Data Complicates My Own Advice
In Part 2, I suggested that a BD group should freeze the base, pilot the stem on one workstream, and only then decide on backfills. This report doesn’t contradict that, but it does complicate the story I told in Part 1 about the base simply shrinking.
Departments with strongly positive ROI did not cut more staff or freeze more hiring than other departments. What set them apart was reorganization. Among the strong-ROI departments, 64% had changed their management structure because of AI, compared with 47% of the rest. Likewise, 84% had significantly changed their workflows, compared with 69% of the rest.
Departments with strongly positive ROI were also more likely to monitor how AI is used, build it into performance reviews, and (critically) train employees adequately. On each of these three aspects, the gap was about 18 to 22 percentage points.
Cutting seems to carry a cost in alignment. Among managers and above whose department reduced staff because of AI, 61% worry about their own role, compared with 18% where no cuts were made. Only 20% describe an aligned organization, compared with 53%.
The entry-level picture is mixed: 24% of managers and above expect fewer entry-level hires over the next two to five years, compared with 14% for executive roles. Yet 82% say AI helps newer employees contribute faster.
I read that as a refinement, not a reversal.
Freezing backfills is defensible if it buys time to redesign the work. Freezing backfills and hoping the shape sorts itself out is the “drift by attrition” route I warned about previously. But this is correlation. The study can’t say whether cuts reduced alignment, or whether less-aligned organizations were simply more likely to cut.
We simply don’t know (yet).
My Advice (Subject to Change Next Month)
- Don’t park in the middle. If AI produces and a person re-reads everything, either automate the check or stop using AI for that task. Remember the dishwasher.
- Pick a rung per task. Tier your BD work by materiality, and let materiality raise human involvement, not AI autonomy.
- Put a name on every decision. The stem produces, while the individual sitting in the crossbar owns the resulting decision.
- Measure the funnel, not just the hours. Add at least one growth-type metric to every BD AI pilot.
- Settle on an approach. Any defined approach beat open experimentation by a wide margin.
- Redesign before you cut. Use a freeze to buy time, not to shrink by drift.
- Own the cost line. Know what your BD stem costs before you claim what it returns.
The report’s one-line forecast for 2027 is that the year may turn less on whether AI works than on the distance between organizations that have transformed their workflows and those that haven’t, as rising costs make partial implementation harder to justify. In BD, that distance will show up in the funnel via the number of opportunities you can see, how fast you can say no, and how confidently you can say yes.
References
Knowledge at Wharton. (2026, October 13). 2026 AI adoption report: The adaptive advantage: Who’s winning with AI and how. https://knowledge.wharton.upenn.edu/special-report/2026-ai-adoption-report/
Velez, C. N. (2026a, September 29). AI for pharma BD & licensing [One-day course]. CELforPharma. https://www.celforpharma.com/course/ai-pharma-business-development-licensing-course
Velez, C. N. (2026b, October 7). The BD org chart is losing its base (From pyramid to T, Part 1). Lacerta Bio. https://lacertabio.com/the-bd-org-chart-is-losing-its-base/
Velez, C. N. (2026c, October 7). Beyond “Learn AI” (From pyramid to T, Part 3). Lacerta Bio. https://lacertabio.com/beyond-learn-ai/
Velez, C. N. (2026d, October 7). Building the T without breaking BD (From pyramid to T, Part 2). Lacerta Bio. https://lacertabio.com/building-the-t-without-breaking-bd/
Velez, C. N. (2026e, September 8). Widening the funnel: How AI changes the math of in-licensing, Part A. Lacerta Bio. https://lacertabio.com/widening-the-funnel/
Wharton Human-AI Research & GBK Collective. (2026a, October). The adaptive advantage: Who’s winning with AI and how(Year four executive summary) [PDF]. https://knowledge.wharton.upenn.edu/wp-content/uploads/2026/10/Wharton-GBK-AI-Adoption-Report-2026_Exec-Summary.pdf
Wharton Human-AI Research & GBK Collective. (2026b, October). The adaptive advantage: Who’s winning with AI and how(Year four full report) [PDF]. https://knowledge.wharton.upenn.edu/wp-content/uploads/2026/10/Wharton-GBK-AI-Adoption-Report-2026.pdf